
Data-Driven SEO Strategy: Why Impressions Rise but Clicks Don't
Data-driven SEO means every change to your site is decided by search data, not by guesses. We share what our own Search Console showed when impressions rose and clicks did not, and the five-step process we use to turn visibility into visits.
Your site shows up in more searches every month, yet the clicks barely move. That gap is the most common SEO problem we see, and it is exactly where a data-driven SEO strategy earns its keep.
Data-driven SEO is the practice of deciding every change to a site, which page to update, merge, write or remove, from real search data rather than from guesses or competitor habits. The data usually sits in Google Search Console already. What is missing is a routine that turns it into a weekly to-do list.
Below we show what that looks like on our own site, then the five steps we use with clients.
What our own data showed: impressions up, clicks flat
We publish in 12 languages. Over the last quarter our blog's impressions grew fast and our average position improved, but clicks barely moved.
When we broke the data down, three things explained almost all of it.
1. Most impressions were on page two or lower
Most of our impressions came from page two and below. On page two, even a strong title earns very few clicks. The problem was ranking, not wording.
2. Our best rankings were for searches where nobody is looking for an agency
Some of our page-one positions came from queries like "what is a search engine algorithm" or hosting comparisons in other languages. People searching those want a quick definition or a product, not a growth partner. Those pages added impressions and very little else.
3. One topic was split across several pages
Our single biggest query, "data driven seo", showed up for several of our posts at once, none of them on page one. Each was a little different, all of them were competing with each other.
This article is the fix for the third one: a single guide that brings the topic together in one place.
The data you need for data-driven SEO
You do not need a stack of tools. You need to know what each source can and cannot tell you.
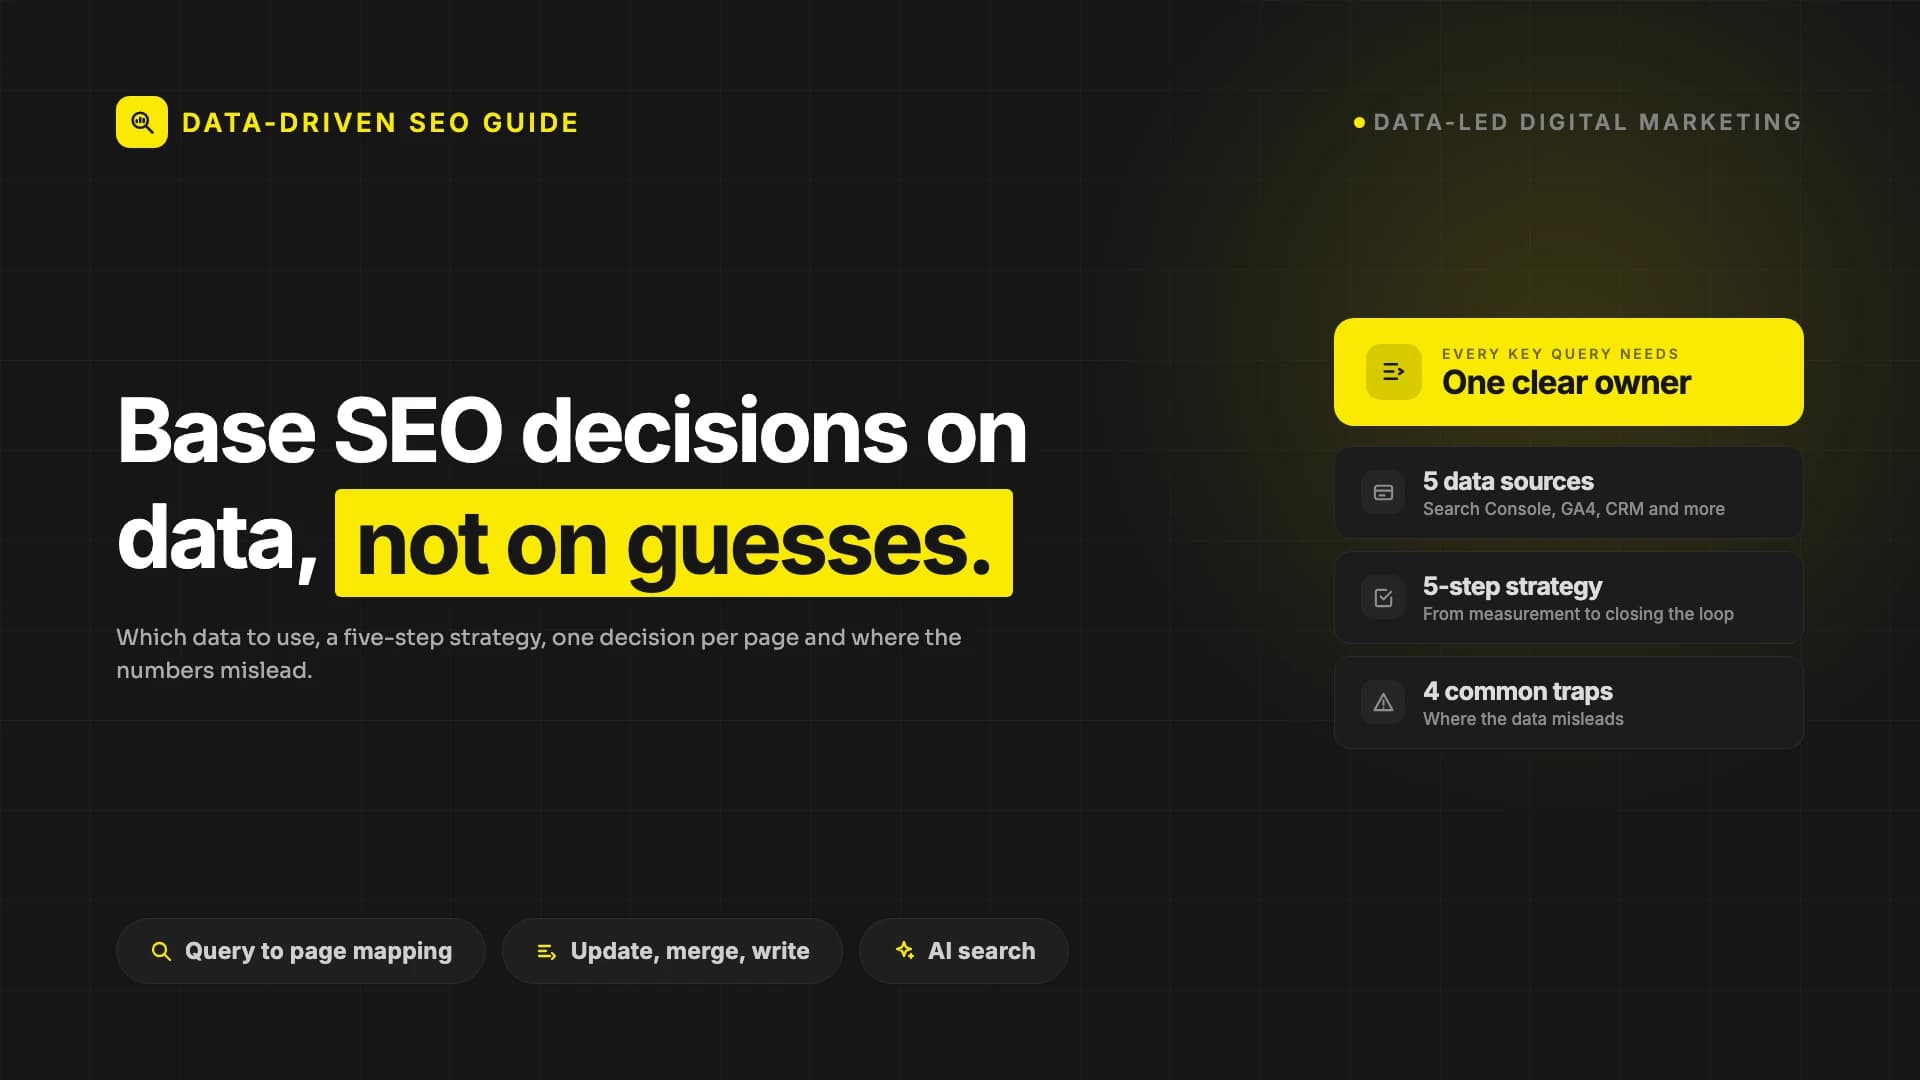
- Google Search Console is the primary source for search: queries, impressions, clicks, average position and which page appeared. Google's Performance report documentation explains how each metric is counted. Search Console now also shows impressions in AI features such as AI Overviews and AI Mode (impressions only, no clicks or queries yet); we covered that in our generative AI report guide.
- Analytics (GA4 or similar) shows what visitors did after they arrived. Consent banners and blockers hide part of the traffic, so never treat a low analytics number alone as proof that a post is unread.
- CRM data shows which content brings people who become leads. See our practical CRM guide.
- Crawl and index data explains why a good page does not appear at all: redirects, canonicals, pages excluded from the index.
- Keyword volume from tools like Keyword Planner helps you name a topic. Only Search Console tells you how your site actually performs for it.
A data-driven SEO strategy in 5 steps
Step 1: Make sure the data is right
Check that Search Console is connected to the right property, that analytics fires on every page and that each language version can be measured on its own. Search Console data arrives a few days late, so empty recent days are not a drop.
Step 2: Give every query one owner
List your important queries and the pages that appear for each. If two or more of your pages take turns for the same search, they are splitting your strength. This is keyword cannibalisation, and it is common on blogs that have been publishing for a while.
Step 3: Sort opportunities by how close they are to a click
- Positions 11 to 20 with real impressions. The fastest wins. A content update, a merge or stronger internal links can move them to page one.
- Page one with almost no clicks. First ask whether the query matches what you sell. If it does, rewrite the title and description so they start with the searcher's own words and promise one specific thing.
- Languages or markets with impressions and no clicks. On multilingual sites the issue is often the search phrase used in that market, not the translation.
Step 4: Make one decision per page
- Update when the page ranks for the right query but the content is dated or incomplete.
- Merge when several pages serve the same intent. Keep the strongest, fold the rest in and redirect the old addresses permanently (301). Google's guide to consolidating duplicate URLs explains how redirects and canonical tags tell Google which address to keep.
- Write when there is demand and no page that answers it.
- Remove pages with neither search value nor business value.
Step 5: Measure, then close the loop
Log the date of every change and compare like-for-like periods. Rankings take weeks to settle. Judging a change after two days is as misleading as never checking at all.
Why impressions rise but clicks don't
If your report shows the same gap ours did, the cause is usually one of these:
- You are visible, but on page two. Growth in impressions often comes from many new rankings in positions 11 to 30. Look at the click share by position before you rewrite anything.
- You rank for the wrong intent. Definitions, trends and "best tool" lists bring impressions from people who will never hire you.
- Your own pages compete. Several similar posts each get a slice and none gets the top spot.
- The answer is on the results page. Some searches are now answered in an AI summary. Whether your brand is cited there is a separate measurement; see our GEO guide and our AEO analysis.
Data-driven SEO and AI search
Google's AI features are built on pages that Google has already crawled and indexed. So the foundation does not change: technically healthy pages that answer one question clearly and own one topic. What changes is the scoreboard. Next to clicks, you now track whether your brand is named as a source.
Start with a baseline: measure before you change anything
Every data-driven SEO decision needs a "before" to compare against. Without one, a rise or fall after a change is just a story. Before we touch a page, we record its starting point.
- Per page: clicks, impressions, click-through rate and average position for the last three months, from Search Console.
- Per query: the main searches the page appears for, and which of your pages Google shows for each.
- Per language or market: the same figures split by country or language folder, so one strong market does not hide a weak one.
- Business result: form submissions, calls or sales that started on that page, from analytics or your CRM.
Compare like-for-like periods, for example the four weeks after a change against the four weeks before, and against the same period last year when demand is seasonal. Note the change date next to the figures so anyone reading the report later knows what happened and when.
Competitor analysis with data, without copying competitors
Competitor data is useful when it answers a specific question: why does another page win the search you want? Start from your own Search Console queries, not from a competitor's keyword list.
- Run the search yourself and look at what Google rewards: guides, product pages, comparisons, local results or videos. That is the intent you have to match.
- Look at what the top pages cover and yours does not: a definition, a step, a price range, an example. Those gaps become the brief for your update.
- Check whether the winning page is newer, better linked internally or the only page on its site about the topic.
- Treat volume and traffic figures from third-party tools as estimates. They are good for comparing topics, not for forecasting your clicks.
The goal is not to copy the structure of the page above you. It is to answer the same search better and more clearly than it does.
Conversion-focused SEO: which KPIs show real results
Impressions and rankings tell you whether you are visible. They do not tell you whether SEO is paying off. So we build our reports on three layers:
- Visibility: impressions and average position for the queries you chose to target, not for every query the site happens to appear for.
- Choice: clicks and click-through rate on page one. This shows whether your title and description win against the other results.
- Business: leads, enquiries or revenue from organic visits. This is the number that decides the budget.
A report that only shows the first layer looks good while the business stands still. A report that only shows the last layer cannot tell you what to fix.
The same logic sets our priorities. When two pages are equally close to page one, we work first on the one that is closer to a sale: a service page, a pricing page or a guide that already brings enquiries. We set up the measurement and run the weekly list of decisions together with you.
Frequently asked questions
What tools do I need for data-driven SEO?
Google Search Console and an analytics tool are enough to start. Connecting your CRM shows which content leads to sales. Paid SEO tools add competitor and volume data but are optional.
How is data-driven SEO different from regular SEO?
The tasks are largely the same: technical upkeep, content, internal links. The difference is that the data decides which task comes first.
How long until I see results?
Title and description changes can show up in click-through rate within a few weeks. Merges and new content usually take longer to settle. Nobody can guarantee a timeline.
Why do my impressions go up while clicks stay flat?
Usually because the new impressions are on page two, for queries with the wrong intent, or split across several of your own pages. Check position, intent and page overlap, in that order.
Next step
Data-driven SEO turns the data your site already produces into a weekly list of decisions. If you want to see where your site is visible but not chosen, explore our SEO and GEO services or get in touch with us.
Your site may look great. Does it actually work?
PumpAudit scans your site across 10 layers and 95 checks: speed, SEO, AI visibility, security, email and conversion. Your score is free and takes a minute or two.